Problem set 2
Due by 11:59 PM on Tuesday, October 2, 2018
Task 0: Getting started
Create a new RStudio project somewhere on your computer. Open that new folder in Windows Explorer or macOS Finder (however you navigate around the files on your computer), and create a subfolder there named data.
Download all these files and place them in your new data/ folder. You’ll probably need to right click on each and choose “Save link as…”.
Download this R Markdown file and place it in your newly-created project Again, you might have to right click on the link and choose “Save link as…”.
It contains an outline/skeleton of the two tasks you’ll need to do in this problem set. Lots of the code is pre-written again!
In the end, the structure of your new project directory should look something like this:
your-project-name\
  your-name_problem-set-2.Rmd
  your-project-name.Rproj
  data\
    The_Fellowship_Of_The_Ring.csv
    The_Two_Towers.csv
    The_Return_Of_The_King.csv
Tasks 1 and 2: Lord of the Rings

Follow the instructions in the R Markdown file you downloaded.
When you’re done, submit a knitted PDF or Word file of your analysis on Learning Suite.
It’s best if the final knitted document is clean and free of warnings and messages (so if a chunk is creating messages, like wherever you run library(tidyverse), add message=FALSE, warning=FALSE to the chunk options).
Also, feel free to remove and replace the placeholder text I’ve given you. Try treating this R Markdown file as something you’ve written.So, instead of keeping the instructions and hints, remove those and make it more narrative, like “I first tidy the data so that I can plot it. I use gather() to make the data set long, and then I…”
Quick refresher on tidy data
ggplot works best when your data is tidy. This doesn’t just mean that the data is clean and free of errors—it refers to data that meets three specific criteria:
- Each variable must have its own column.
- Each observation must have its own row.
- Each value must have its own cell.
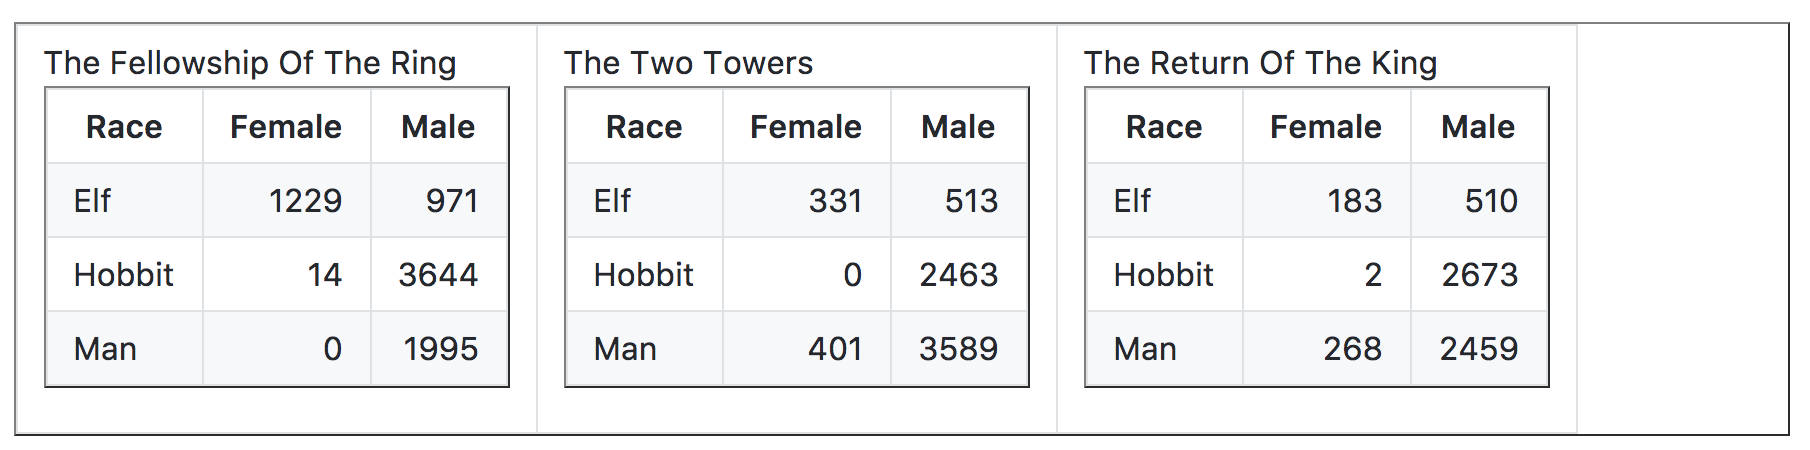
Data you come across in the real world is often not tidy—not because it’s wrong, but because it’s structured in a way that makes it easier for humans to read. For instance, look at this table of words spoken in Peter Jackson’s Lord of the Rings trilogy:Data from Jenny Bryan’s lesson on tidy data.
Tidy data makes these kinds of calculations far easier. Here’s that same data in tidy format:
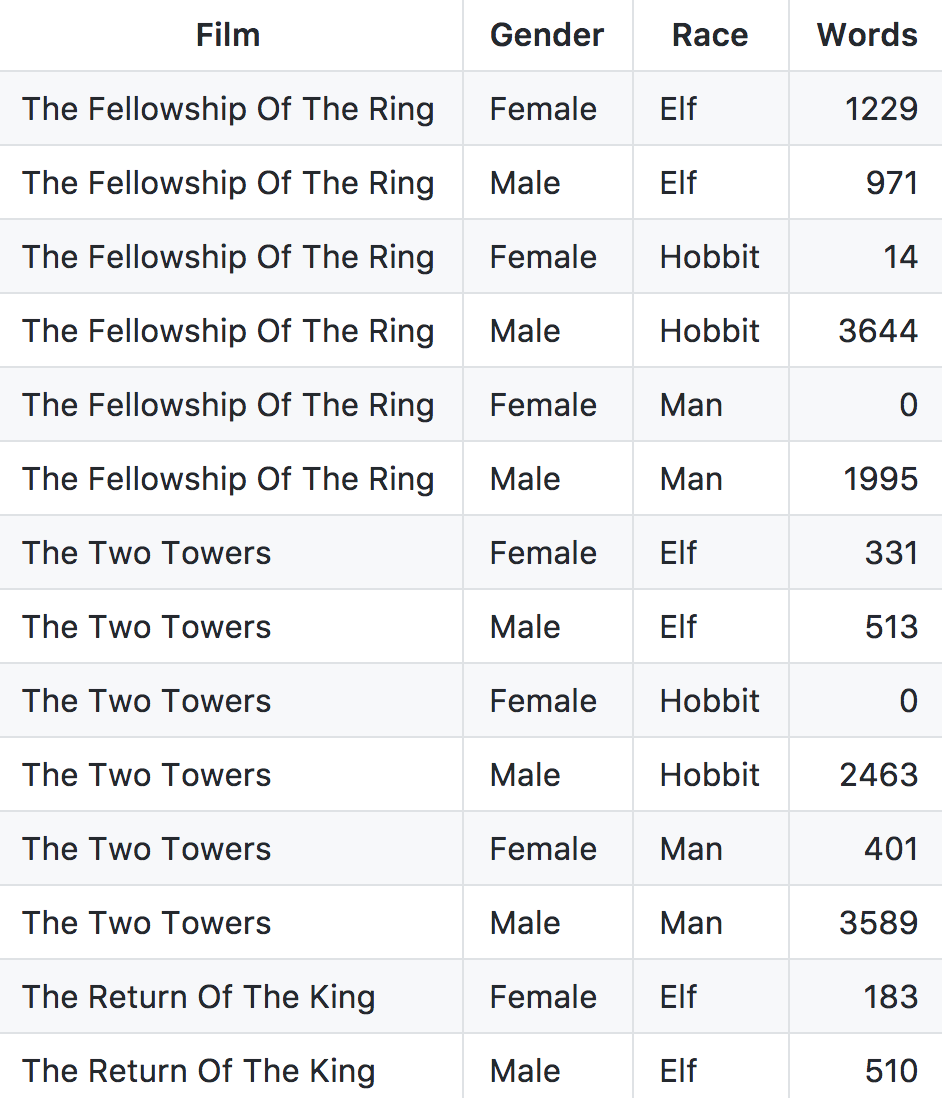
This is longer and more repetitive (and perhaps ugly), but far, far easier for computers to work with. Each varaible has its own column now (Film, Gender, Race, and Words), each observation has its own row, and each value is in its own cell.
Untidy data comes in lots of different forms, but the R package tidyr (which is part of the tidyverse and is loaded when you run library(tidyverse)), can tidyify pretty much anything. You can see full details in this vignette for tidyr.