Enhancing graphics
Materials for class on Tuesday, December 4, 2018
Contents
Slides
No slides today!
Live code
Use this link to see the code that I’m actually typing:
I’ve saved the R script to Dropbox, and that link goes to a live version of that file. Refresh or re-open the link as needed to copy/paste code I type up on the screen.
Sharing graphics, code, and analysis
- Knitting as PDF or Word
- Knitting as HTML
- Publishing at RStudio Connect
- Publishing at RPubs
- GitHub and Gists
Entire projects:
Refining and enhancing interactive plots
This all goes beyond the scope of this class, because interactive HTML plots all require knowledge of JavaScript and we don’t have time in this class to learn a second programming language.Even in a 3-credit version of this class I wouldn’t cover JavaScript and D3—it would require its own class.
But there are some cool resources for making and enhancing interactive plots:
- plotly: You’ve already been exposed to this in this class. If you feed a ggplot object to
ggplotly()in theplotlylibrary, you can have instant interactivity. There are all sorts of adjustments you can make without touching JavaScript—look at the documentation for extensive examples. - Highcharts: This is a competitor to plotly and works kind of similarly, but doesn’t let you feed pre-made ggplot objects to it. You have to follow a different syntax. It’s very well documented, though, and you can avoid using any JavaScript. Its R package is very well documented.
- Lots of others: There are actually a bunch of other dataviz-focused JavaScript libraries. There’s a neat gallery of examples here, with maps, flowcharts, network diagrams, etc., and these libraries are all generally well documented too.
- D3: This is an entire dialect of JavaScript focused on data-driven documents (hence D3). It’s a very high level way of graphing things—you have to to a lot of manual labor and it can be miserable, but you can make incredible stuff. Lots of the libraries in the gallery linked above use D3 behind the scenes. R has a way of working with D3 animations within RStudio using the superbly named R2D3 package.Look at its hex sticker!
Refining and enhancing static plots
Install a vector image editor
- Adobe Illustrator: This is the industry standard vector editor; it’s expensive, but it’s free for BYU student employees.
- Inkscape: This is an open source editor, so it’s free (yay!) but can be clunky to work with (boo). It’s sufficient for what we’re going to be doing, though.
- Important for Mac users: you have to install XQuartz before installing Inkscape, which is fine because you also need it for embedding custom fonts in R anyway
- Also, the developers haven’t paid for a macOS developer certificate, so Inkscape might show an error saying it can’t open the first time you try to open it. If that happens, go find it in your “Applications” folder, right click on Inkscape, and choose “Open”. You only have to do this one time—after you’ve opened it like this once, it will open just fine in the future.
- Gravit Designer: This is a freemium vector editor that you can use in your browser or through a desktop application. It works fairly well, but the free verison won’t embed fonts. If you want to embed fonts, export your refined graphic as an SVG,This is the universal vector image format, like CSV is the universal data format
open that SVG in Inkscape, and use Inkscape to export as a PDF with embedded fonts.
Make an image and refine it
Data: Nathan’s Famous Hot Dog contest winners Data originally from FlowingData.
Plot with transparent background:
library(tidyverse)hotdogs <- read_csv("https://datavizf18.classes.andrewheiss.com/data/hot-dog-contest-winners.csv") %>%
rename(dogs = `Dogs eaten`, record = `New record`) %>%
mutate(record = factor(record))plot_hotdogs <- ggplot(hotdogs, aes(x = Year, y = dogs, fill = record)) +
geom_col() +
scale_fill_manual(values = c("grey80", "#FC7300")) +
scale_x_continuous(breaks = seq(1980, 2010, 2), expand = c(0, 0)) +
scale_y_continuous(breaks = seq(0, 70, 10), expand = c(0, 0)) +
guides(fill = FALSE) +
labs(y = "Hot dogs and buns", x = NULL) +
theme_minimal() +
theme(panel.background = element_rect(fill = "transparent", colour = NA),
plot.background = element_rect(fill = "transparent", colour = NA),
axis.ticks.x = element_line(size = 0.25),
panel.grid.major.x = element_blank(),
panel.grid.major.y = element_line(size = 0.5, linetype = "dashed"),
panel.grid.minor = element_blank())
plot_hotdogs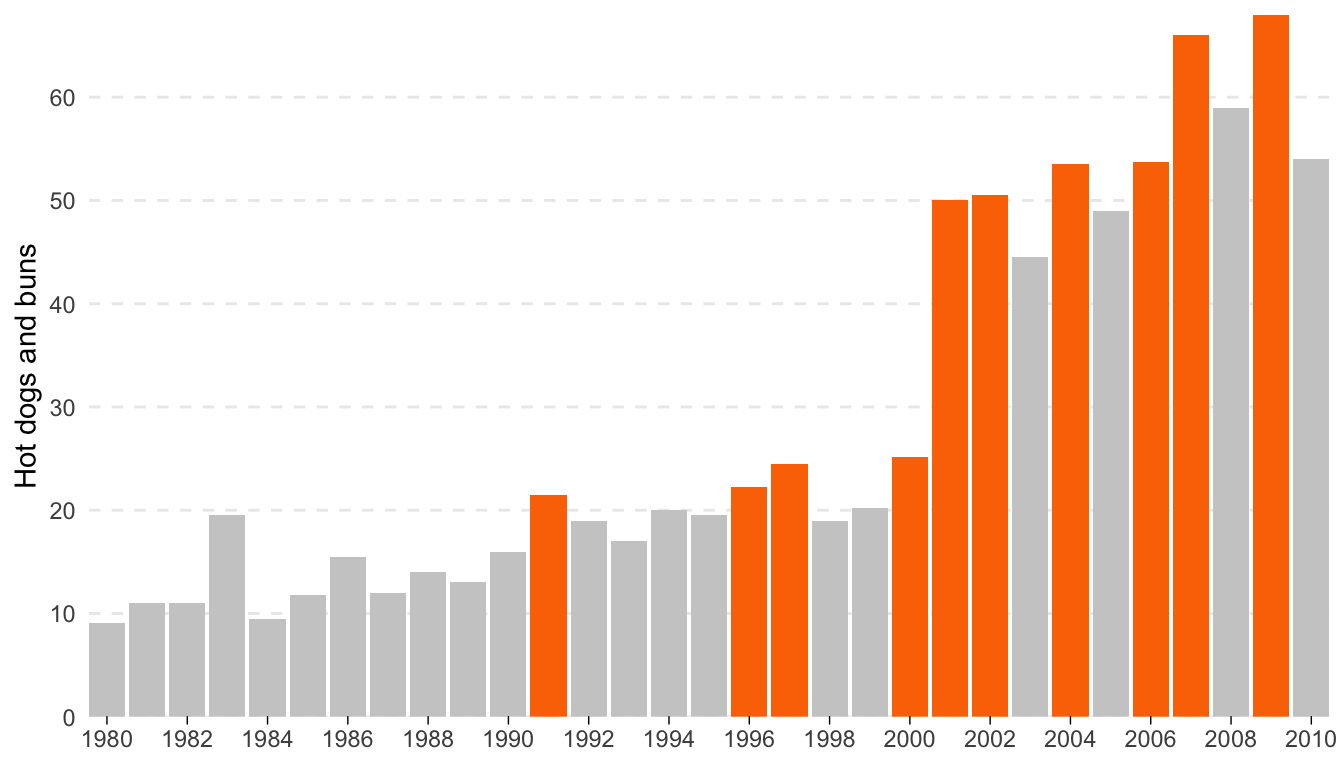
ggsave(plot_hotdogs, filename = "output/hotdogs.pdf", device = cairo_pdf,
       width = 7, height = 4, units = "in", bg = "transparent")
Text for annotations:
- Winners from Nathan’s Hot Dog Eating Contest
- It’s that time of year again. Since 1916, the annual eating competition has grown substantially attracting competitors from around the world
- Frank Dellarosa eats 21 and a half HDBs over 12 minutes, breaking the previous record of 19 and a half
- Through 2001-2005, Takeru Kobayashi wins by no less than 12 HDBs. In 2006 he only wins by 1.75. After winning 6 years in a row and setting the world record 4 times, Kobayashi places second in 2007.
- For the first time since 1999, an American reclaims the title when Joey Chestnut consumes 66 HDBs, a new world record. Chestnut repeats in 2008.
- Source: Wikipedia and Nathan’s Famous
Original enhanced plot:
Enhanced hot dog eating contest graph
Clearest and muddiest things
Go to this form and answer these two questions:
- What was the muddiest thing from class today? What are you still wondering about?
- What was the clearest thing from class today? What was the most exciting thing you learned?
I’ll compile the questions and send out answers after class.